What is the Best Airflow and Airflow Patterns in an Individually Ventilated Cage?
THE FIRST INDIVIDUALLY VENTILATED CAGING SYSTEMS (IVC) were brought onto the laboratory animal market about 40 years ago. Those systems then and now are known as forced-air systems: using motors they force air into and out of the cage through small holes, usually smaller than the size of a small coin. This results in high airflow and turbulence, which rodents are averse to – imagine an owl beating its wings as it plunges down to grab a mouse with its talons…what is the last thing the mouse feels? Airflow and turbulence from the wings of the owl! Their instincts tell them something is wrong when they detect either.
Our founder, Dr. Germain Rivard, a PhD neuroscientist and veterinarian working with rodents housed in IVCs in the mid-1990s, knew he could enhance the welfare of rodents by making some critical changes to the mechanical and architectural design of the forced-air IVCs.
Dr. Rivard’s innovation was to design a cage that moves air calmly through the cage from the front to the back, using large filter openings, and without the need for motors.
- When the openings are on opposite sides of the cage, the air will travel in a straight path from one side to the other.
- When the openings are large, the air can move very slowly and clear out more waste gases and allergens than a turbulent forced-air cage.
- When you don’t need to force the supply air into the cage, motors are not required.
When it comes to airflow in cages, there are two types:
- Laminar airflow, (Animal Care Systems IVC systems): clean air enters at the front of the cage through a large, filtered opening and flows in a steady manner with constant velocity and pressure, capturing and carrying airborne contaminants with it to the rear of the cage where the waste air exits. With this type of airflow, the required air changes per hour are low because the clean air displaces the dirty air as it travels through the cage.
- Dilution airflow: a supply of high-velocity clean air enters the cage forcibly through a small port and mixes with the contaminated air in a turbulent fashion (fluctuating particle speed and continual particle mixing) to dilute the contaminated air, and a portion of the contaminated air is exhausted out of the cage in the same vicinity as the supply port. With this type of airflow, the required air changes per hour are high because only a portion of the dirty air, mixed with the clean air, can be exhausted through a small hole. A motor is needed to drive the necessary high velocity and volume of air.
Watch an Animation of Laminar Airflow in an IVC Cage
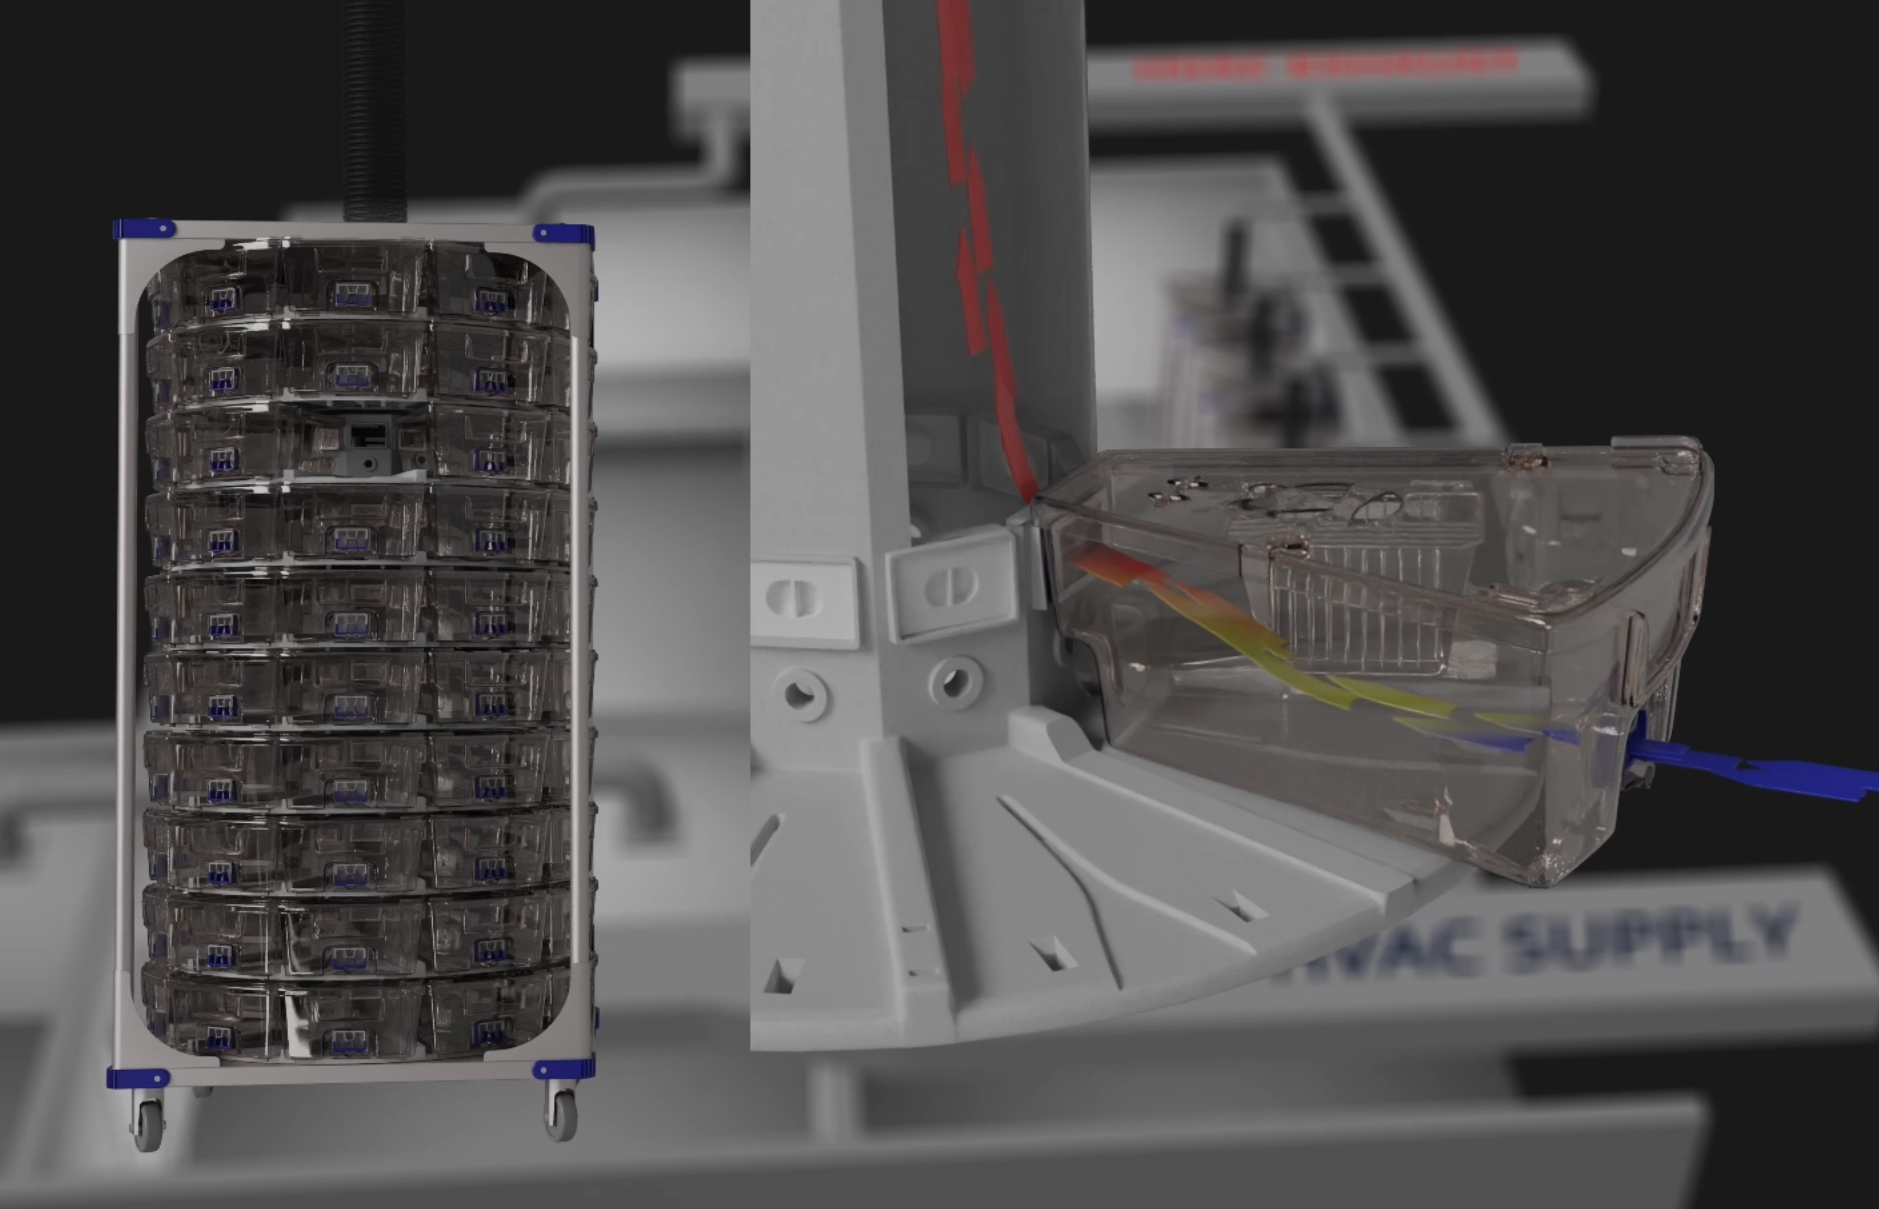
This graphic illustrates how the air moves through an Animal Care Systems Optimice cage. The blue color represents the room air entering the cage through the front filter, the yellow air is the cage air as it moves through the cage, and the red color represents the waste air (a mixture of ammonia, allergens, exhaled air, and particulate matter from the bedding and nesting) exiting the cage.
Graphics, like the one above, are used to demonstrate the theoretical movement through a shape. However, the proof is to then test the theory with a real field test. In this case, we recommend the tried-and-true ACS Smoke Test.
Watch the Airflow Distribution Pattern in an Optimice IVC Cage
Filling an empty cage with smoke, docking it, and then watching the smoke patterns and how the smoke exits the cage is an excellent way to visualize airflow speed and airflow patterns.
As you can see, all the smoke is cleared from an Optimice cage in just 3 minutes, including at the bedding level, which is where mice spend most of their time in the cage. The air in this cage is travelling at 4 to 6 feet per minute, well below the 39 feet per minute (0.2 meters per second) established as the air speed that rodents are able to detect (and prefer to avoid) by Brandstetter et. al. in 2005.
In order to visualize your cage’s airflow and air patterns, you can “watch” the air for yourself using smoke to see how the air introduced into the cage affects the smoke. The above demonstration graphic can be helpful, but as we know, the real test is to see it for yourself. If you buy a car that claims a specific fuel efficiency – you’ll track it. If a new dishwasher claims to clean properly in cold water, you’ll inspect the dishes as you bring them out. It’s just human nature to double check! Just one word of warning: make sure that if you test your own non-ACS cages in your facility, you do it in a well-ventilated room because you do not want to set off any smoke alarms, or have smoke enter neighbouring racks or cages (in the case of positive pressure racks, which exhaust to the room).
In summary, to achieve the best airflow and airflow patterns, an individually ventilated cage requires a cage with laminar airflow that is calm and gentle and with supply and exhaust ports that are on opposite sides of the cage.
- Brandstetter, M. Scheer, C. Heinekamp, C. Gippner-Steppert, O. Loge, L. Ruprecht, B. Thull, R. Wagner, P. Wilhelm & H.P. Scheuber. Performance evaluation of IVC systems. Laboratory Animals (2005) 39, 40–4